What you’ll learn: How to design a cross-stack experiment that tests output agreement without turning a small analytical workload into a misleading language benchmark.
data scienceelixirpythonreproducibilitymachine learning
On this page
I did not want to write "Elixir versus Python for data science."
That title asks for a winner before it defines the work. It invites runtime bars without a benchmark protocol, ecosystem claims without a fixed problem, and conclusions much larger than the evidence.
So I used a stricter comparison:
Hold the data, question, transformations, and acceptance criteria constant. Then examine what the two stacks make easier, harder, faster to express, and easier to trust.
The result is less dramatic and more useful. Two separate language-level implementations - one in Elixir, one in Python - took the same first-party Bureau of Labor Statistics data through the same descriptive clustering experiment. Their preserved run records report matching profile counts, centroids, inertia, and conclusions after accounting for arbitrary cluster IDs.
That summary agreement is evidence that the implementations converge on one bounded aggregate result. It is not evidence that every month received the same assignment, that either language is universally better, that the clusters are real economic regimes, or that this sample measures production performance.
The comparison contract#
The experiment asks one narrow question: can K-means separate recurring combinations of observed U.S. inflation and unemployment in a fixed 2006-2025 request window?
The source is the BLS Public Data API. The CPI series is CUUR0000SA0, which the BLS series-code guide identifies as CPI-U, U.S. city average, all items, not seasonally adjusted. The unemployment series is LNS14000000, the seasonally adjusted civilian unemployment rate. The analysis converts CPI-U to its 12-month percentage change and uses the published unemployment-rate level as the second feature. BLS documents the CPI series code; the repository source records preserve the exact request and treatment.
| Contract surface | Fixed choice | Acceptance evidence |
|---|---|---|
| Source | BLS series CUUR0000SA0 and LNS14000000 | Exact series IDs and API endpoint are recorded |
| Request window | January 2006 through December 2025 | Two anonymous 10-year API requests |
| Derived sample | January 2007 through December 2025 | First 12 months supply the CPI lag |
| Missing data | Exclude unavailable October 2025; no interpolation | 227 aligned observations |
| Features | 12-month CPI-U change and unemployment-rate level | Same formulas and inner alignment |
| Standardization | Population mean and scale for each feature | Same 2-column standardized space |
| Model | K-means, 3 clusters, seed 42, 20 starts | Matching reported counts and centroids |
| Numerical checks | Inertia 129.7056; Python silhouette 0.5236 | Fixture generator stops if values drift |
October 2025 is a source fact, not a cleaning accident. The BLS CPI notice and Current Population Survey notice explain that data for that month were unavailable because of the 2025 lapse in appropriations. Both implementations retain the unavailable records and footnotes, exclude the month during alignment, and do not invent a replacement value.
The preserved comparison uses the August 16, 2026 run records. The Elixir repository now also contains a later run through July 2026. That extension is useful, but it is not paired with a matching Python execution, so it is outside this comparison.
One experiment, two language-level pipelines#
The pipelines share a contract and Polars-family native execution for dataframe work, but not application code, orchestration, model libraries, or notebook systems.
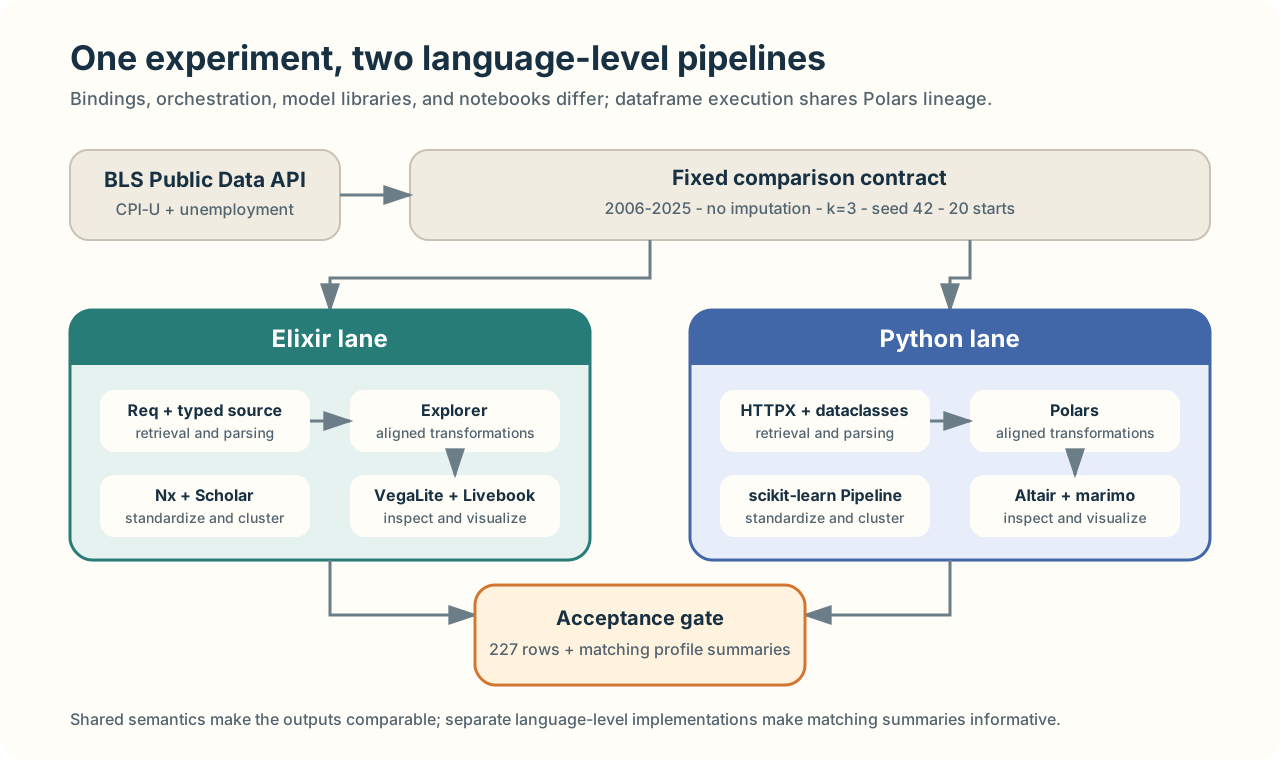
This separation matters. Shared fixtures can make two implementations agree because they share the same mistake. Here, each repository owns its retrieval client, parser, dataframe binding and transformation code, standardization, clustering call, tests, notebook, and lockfile.
The Elixir path uses Req for HTTP, Explorer for dataframe work, Nx for the numerical boundary, Scholar for K-means, and VegaLite inside Livebook. Explorer 0.12's default backend reaches Polars through NIF bindings. The Python path uses HTTPX, the Python Polars bindings, a scikit-learn Pipeline, Altair, and marimo. Transformation timing is therefore partly shared-engine evidence; ergonomics, runtime ownership, correctness boundaries, and orchestration remain meaningfully different.
First understand the data result#
The scatterplot is about the analytical question, not about language performance.
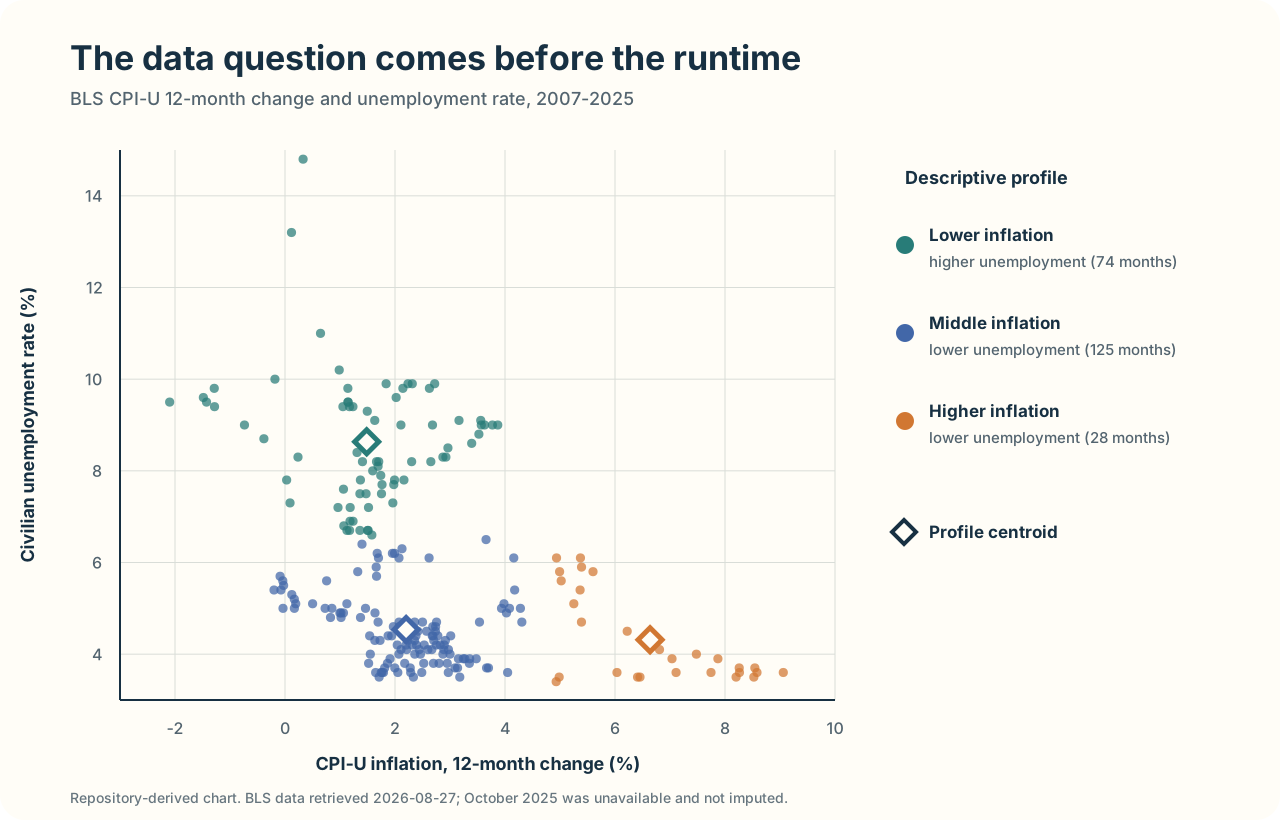
The three profiles are descriptive summaries:
| Profile | Months | Mean 12-month CPI inflation | Mean unemployment | Elixir ID | Python ID |
|---|---|---|---|---|---|
| Lower inflation / higher unemployment | 74 | 1.48% | 8.63% | 2 | 2 |
| Middle inflation / lower unemployment | 125 | 2.20% | 4.54% | 1 | 0 |
| Higher inflation / lower unemployment | 28 | 6.64% | 4.31% | 0 | 1 |
Those names describe relative means inside this sample. They are not business-cycle labels. The model sees two standardized numerical features; it does not see recessions, policy changes, causes, forecasts, or dates.
The profile means also hide time order and dispersion. A point from 2008 can sit near a point from 2020 because K-means only sees its location in the two-feature space. Monthly observations are serially related, and the 12-month inflation windows overlap. Treating 227 rows as 227 independent economic experiments would overstate the evidence.
Agreement without pretending the evidence is stronger than it is#
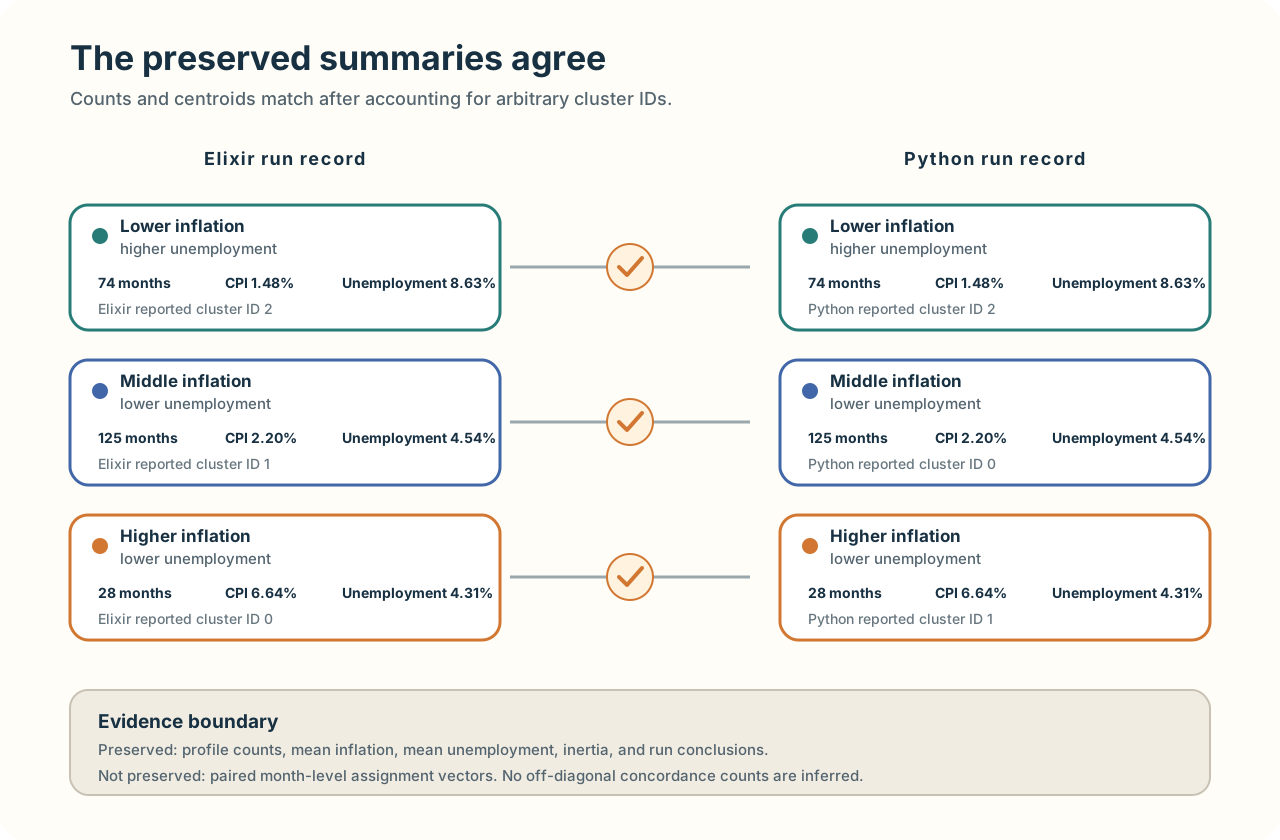
K-means cluster IDs are arbitrary. Elixir can call a group 1 while Python calls the same group 0. Comparing raw IDs would turn agreement into a false mismatch.
The preserved run records report matching profile counts, centroids, inertia, and conclusions after label matching. They do not preserve two month-level assignment vectors, so an off-diagonal concordance matrix cannot be reconstructed from the available evidence. The figure stays at the summary level the records actually support.
The Python repository adds a separate sensitivity diagnostic over k=2..6 and five seeds. For k=3, its assignments are identical across the tested seeds and its mean pairwise adjusted Rand index is 1.0. That supports stability within the locked Python sample and configuration. It does not retroactively prove that the Elixir library ran the same diagnostic, and it does not select a true number of economic regimes.
This is the first important stack difference: the Python ecosystem made it straightforward to add silhouette and adjusted Rand metrics from the same model surface. The Elixir experiment kept a smaller validation surface and used the independent Python implementation as its main cross-check. That is an observed difference between these repositories, not a permanent statement about either ecosystem.
What each stack actually owns#
Once output agreement is established, the comparison can move from "did they get the same answer?" to "where does each stack place responsibility?"
| Boundary | Elixir implementation | Python implementation | What changes for the reviewer |
|---|---|---|---|
| Retrieval | Req 0.7.2 | HTTPX 0.28.1 | Both expose request failures and preserve unavailable values |
| Source model | Typed maps and module types | Frozen, slotted dataclasses | Both separate numeric and unavailable BLS points |
| Dataframe | Explorer 0.12.0, Polars-backed by default | Polars 1.43.2 | Engine lineage overlaps; bindings, process ownership, and orchestration differ |
| Numerical layer | Nx 0.13.1 with an EXLA backend | NumPy 2.5.2 inside scikit-learn | Elixir makes the backend boundary explicit; Python hides more behind the estimator |
| Clustering | Scholar 0.4.2 | scikit-learn 1.9.0 | Both fix the seed and repeat initialization 20 times |
| Notebook | Livebook 0.19.8 | marimo 0.23.16 | Both are source-reviewable; their reactive and runtime models differ |
| Visualization | VegaLite 0.1.11 | Altair 6.2.2 | Both emit Vega-Lite-shaped declarative charts |
| Dependency evidence | mix.lock, pinned Elixir/OTP and container | uv.lock, pinned Python, cross-platform resolution | Both make the full dependency graph reviewable |
| Validation | Mix tests, formatter, Livebook check, Hex audit | Ruff, mypy, pytest, marimo check, pip-audit | Python uses more separate tools; Elixir uses a smaller native toolchain plus audits |
The table is more revealing than a language feature checklist.
In Elixir, the numerical engine is visibly a boundary. Explorer's default backend reaches Polars through NIF bindings. Nx selects a numerical backend. Scholar consumes tensors. The code has to name those handoffs, which makes runtime ownership easy to diagram. It also means the setup has more layers to understand before the first model fits.
In Python, the analytical path is more continuous. Polars produces the feature matrix, and a scikit-learn Pipeline owns standardization and K-means as one fitted object. Adding diagnostics uses nearby APIs. The cost of that familiarity is that important operational boundaries can disappear behind a smooth notebook unless the repository deliberately records them.
Neither observation is a universal win. Explicit boundaries can improve review and increase setup work. A broad integrated ecosystem can accelerate analysis and make hidden assumptions easier to overlook.
Why there is no runtime bar chart#
This sample is too small to support a serious performance conclusion.
With 227 two-feature observations, timing would be dominated by choices around startup, compilation, dependency loading, HTTP retrieval, notebook state, and warm versus cold execution. A single bar labeled "Elixir" next to one labeled "Python" would compress those different costs into a number that looks precise and says very little.
A defensible performance comparison needs at least:
- a workload large enough for parsing, allocation, dataframe execution, and model fitting to dominate startup;
- repeated runs with distributions rather than one elapsed time;
- explicit hardware, operating system, language, runtime, and dependency versions;
- separate cold and warm states;
- peak memory and output checks, not only wall-clock time; and
- a rule for excluding network retrieval from compute timing without hiding retrieval behavior.
That is why the next useful workload is larger, not more optimized. QCEW-sized parsing and grouping can expose lazy execution and memory pressure. Hourly EIA data can test incremental retrieval, concurrency, retries, and gaps. ACS PUMS can make correctness depend on weights, replicate calculations, and margins of error.
Performance belongs in that later evidence set.
What I trust after this experiment#
I trust four bounded conclusions.
First, the preserved paired run records report matching aggregate profile summaries for this locked question and sample. The committed normalized BLS fixture, retrieved on August 27, 2026, reproduces 227 observations, inertia 129.7056, silhouette 0.5236, and the 74/125/28 profile counts when assigned against the preserved centroids. That generator check is not a rerun of both language stacks.
Second, source treatment survived both implementations. October 2025 remained explicitly unavailable, with BLS footnotes preserved and no imputation.
Third, Python supplied a wider ready-made evaluation surface for this experiment. The sensitivity table was easier to add because scikit-learn already places K-means and clustering metrics in the same mature library.
Fourth, Elixir made the execution boundaries unusually legible. Retrieval, dataframe work, tensor preparation, model fitting, and notebook rendering remain distinct modules and libraries. That is useful when the question is not only "did the notebook run?" but "which runtime owns this result?"
I do not yet trust a speed ranking, a memory ranking, a production-operability ranking, or a claim that either stack is better for data science in general. Those conclusions require different workloads and more measurements.
Reproduce the evidence#
The comparison is anchored to immutable repository revisions:
- Elixir source at
5b918d49and its preserved 2006-2025 run record - Python source at
33d768daand its preserved 2006-2025 run record - Machine-readable figure manifest, including the retrieval timestamp, exact request windows, raw-response SHA-256, normalized-fixture SHA-256, transformation contract, acceptance values, profile mapping, and derived observations
The website generator runs with:
npm run visuals:same-dataThat default command reads a committed, hash-pinned normalized BLS extract. It preserves unavailable records, derives the comparison observations, assigns them against the preserved centroids, recomputes inertia and silhouette, and refuses to write the figures unless all acceptance values match. Because it uses the fixture's retrieval timestamp rather than the current clock, repeated default runs are byte-reproducible.
Refreshing the source is a separate, explicit operation:
npm run visuals:same-data:refreshRefresh mode fetches the two live BLS windows and replaces the normalized fixture only after the same acceptance checks pass. The static SVGs are publication artifacts; the fixture and JSON manifest are the audit path behind them.
The BLS terms require attribution and a retrieval date. They also require this statement:
BLS.gov cannot vouch for the data or analyses derived from these data after the data have been retrieved from BLS.gov.
The charts and interpretations here are repository-derived. They are not BLS analysis.
The series starts here#
This first chapter proves the method, not the winner.
The useful pattern is to keep moving the same contract across harder workloads: larger data, continuous data, and statistically demanding data. Only after those runs exist will a synthesis about runtime, memory, concurrency, notebook ergonomics, dependency risk, and correctness have enough evidence to be worth publishing.
For now, the strongest result is simple: two stacks can disagree about almost every implementation detail and still be held to the same question.
That is a much better starting point than "versus."
Sources and evidence dates#
- BLS Public Data API, accessed August 27, 2026
- BLS API signatures, accessed August 27, 2026
- BLS terms of service, accessed August 27, 2026
- BLS CPI series ID guide, accessed August 27, 2026
- BLS CPI shutdown impact notice, accessed August 27, 2026
- BLS Current Population Survey shutdown impact notice, accessed August 27, 2026
- Explorer 0.12 documentation, accessed August 27, 2026
- Elixir and Python paired run records, executed August 16, 2026 and linked above